Notes from Lean Analytics
Page 28:
Page 38:
Humans do inspiration; machines do validation … change favors local maxima; innovation favors global distruption.
Ten common pitfalls:
- Asssuming the data is clean
- Not normalizing
- Excluding outliers
- Including outliers
- Ignoring seasonality
- Ignoring size when reporting growth
- Data vomit
- Metrics that cry wolf
- The “Not Collected Here” syndrome
- Focusing on noise
Page 50:
The most important question in the survey is “How would you feel if you could no longer use this product or service?” In Sean’s experience, if 40% of people (or more) say they’d be very disappointed to lose the service, you’ve found a fit, and now it’s time to scale.
Page 73:
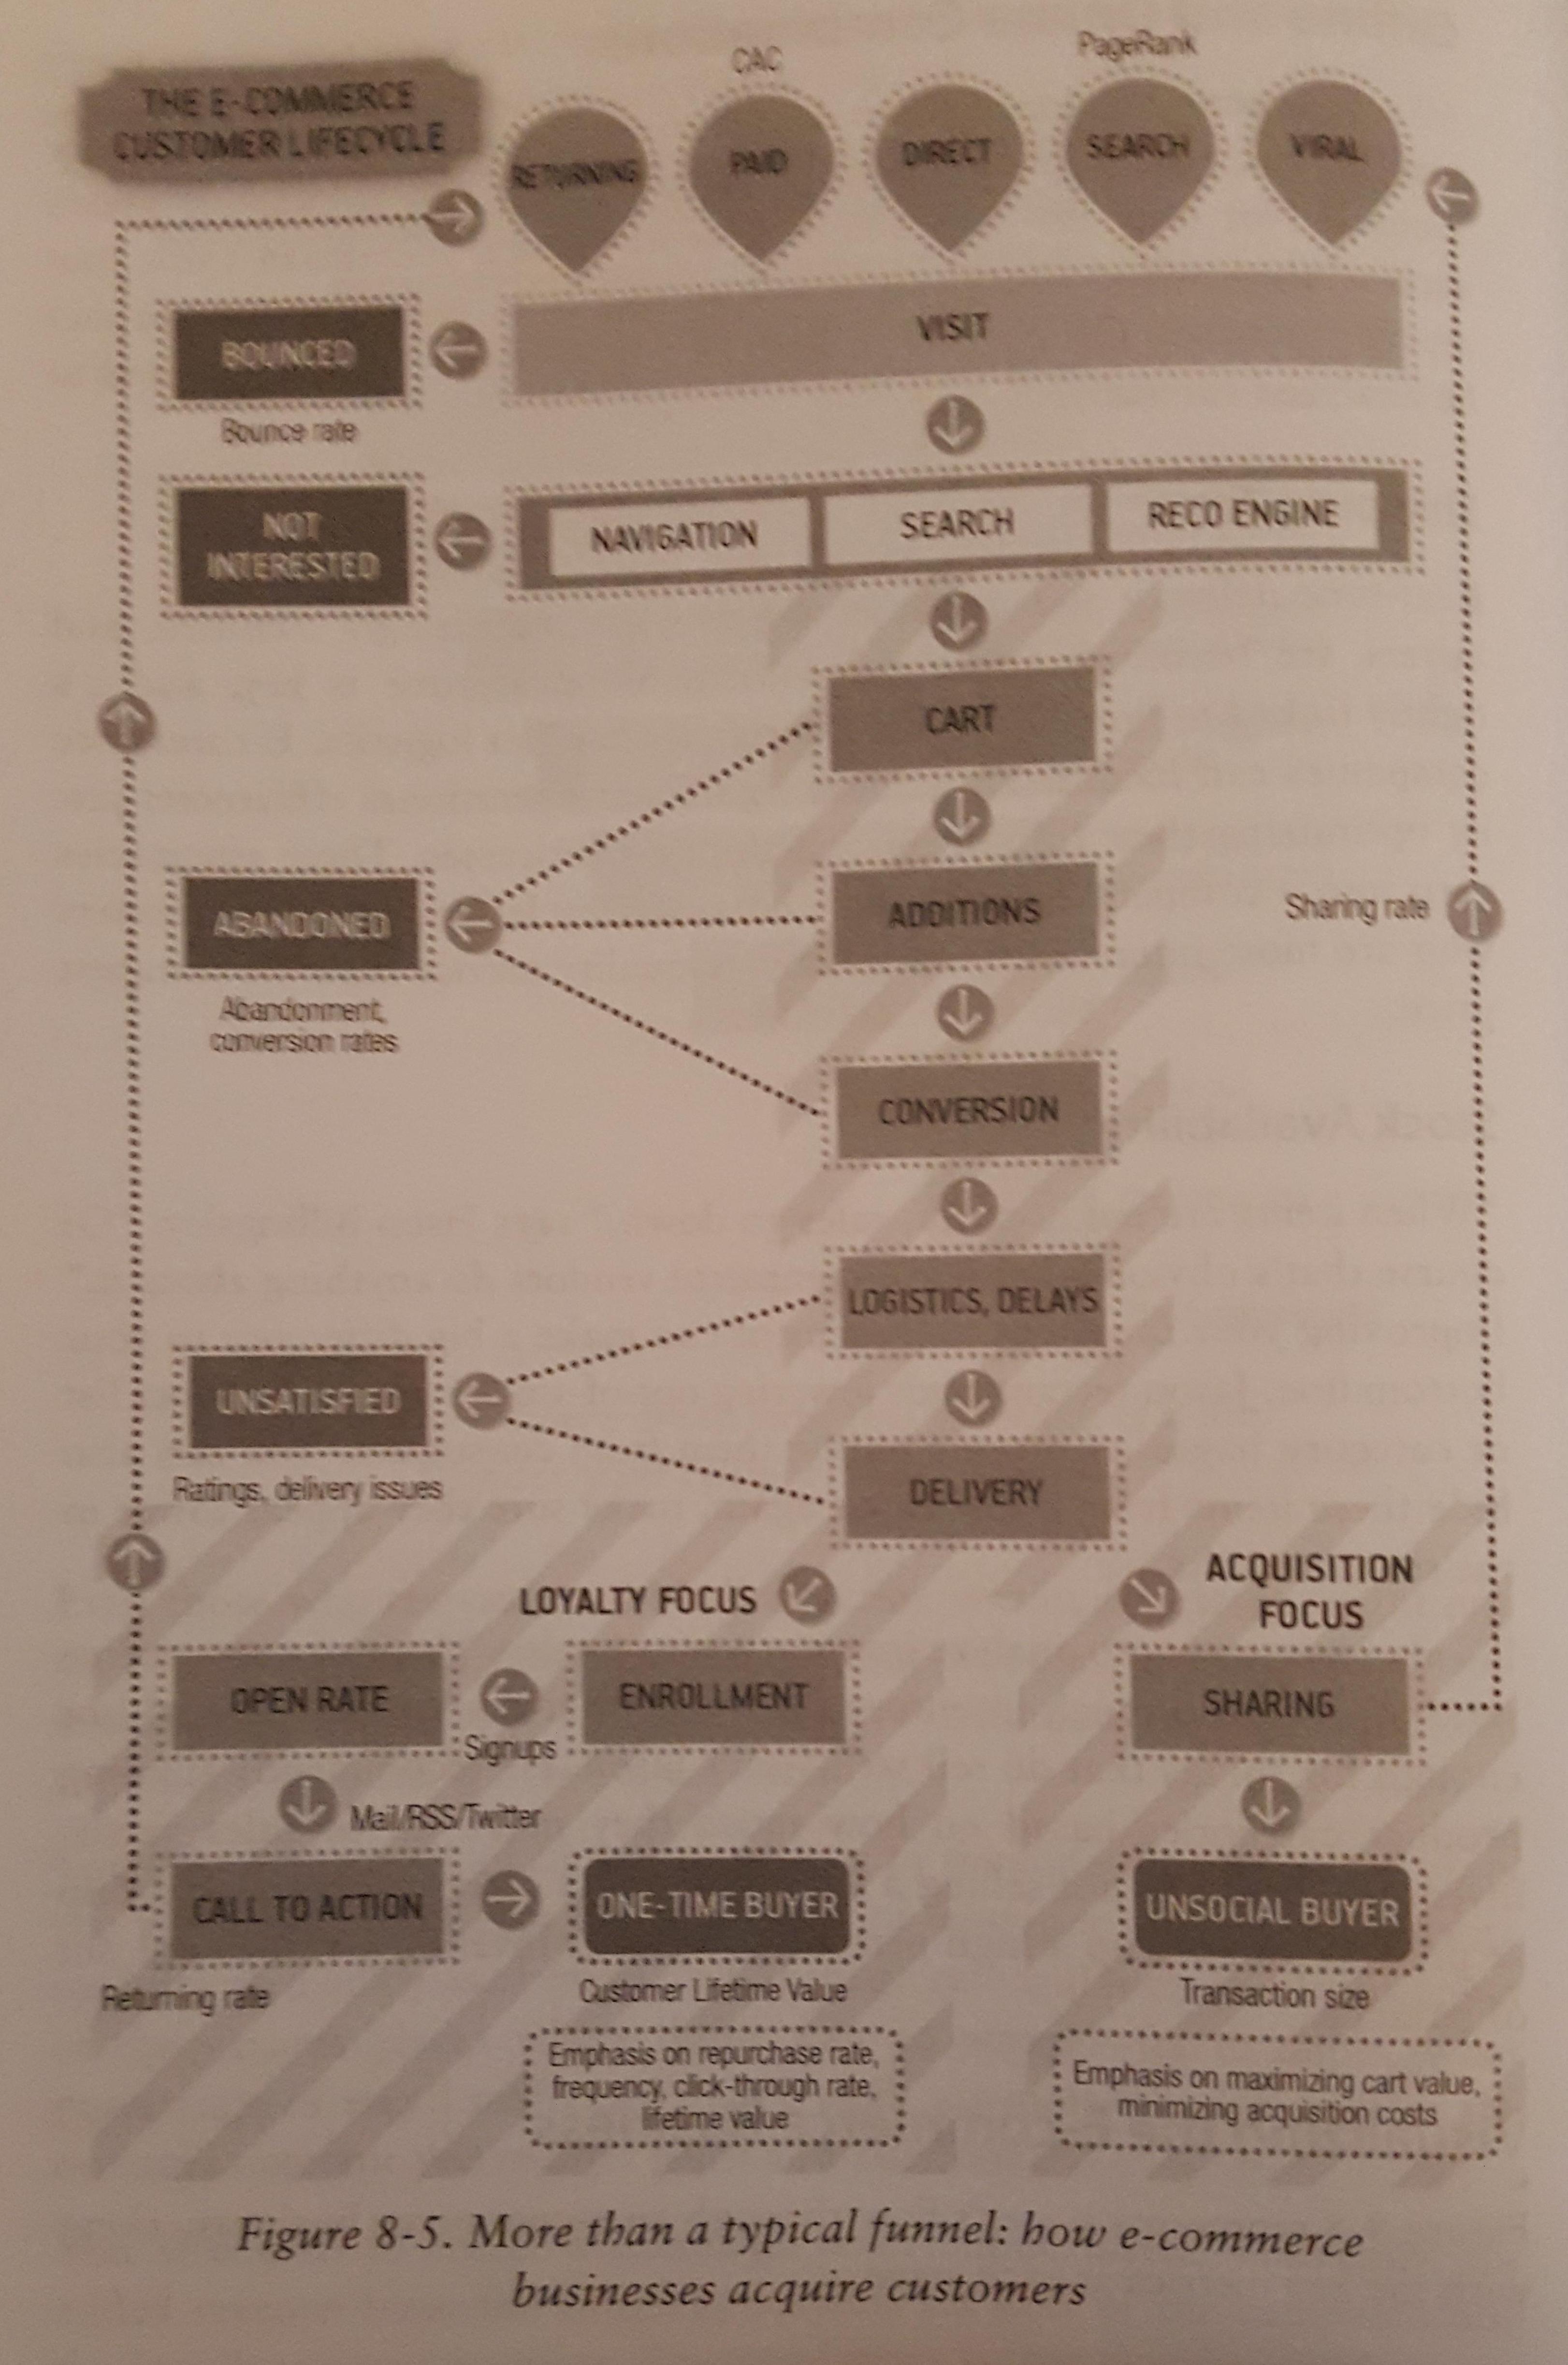
What mode of E-commerce are you?
- Acquisition mode - if less than 40% of last year’s buyers will buy this year, then the focus on the business is on new customer acquisition … 70% of e-commerce business fall into this category when they’re mature.
- Hybrid mode - if 40-60% of last year’s buyers will buy this year, then the company will grow with a mix of new customers and returning customers. It needs to focus on acquisition as well as on increasing purchase frequency.
- Loyalty mode - If 60% or more of last year’s buyers will buy something this year, the comapny needs to focus on loyalty, encouraging loyal clients to buy more frequently.
A 90-day repurchase rate of 1% to 15% means you’re in acquisition mode. 15-30% means you’re in hyrbid mode. 30% means you’re in loyalty mode.
Page 86:
Page 98:

Page 175:
- Cloud9 IDE decided to run scored customer interviews even though the company was well past the Empathy stage.
- The interviews showed that customers were happy, but also revealed two specific customer segments that derived higher value from the product.
- Using this insight, the company compared analytics data and verified that these groups were indeed using the product differently, which is now driving the prioritization of features and marketing.
Page 208:
Seven questions to ask yourself before building a feature:
- Why will it make things better?
- Can you measure the effect of the feature?
- How long will the feature take to build?
- Will the feature overcomplicate things?
- How much risk is there in this new feature?
- How innovative is the new feature?
- What so users say they want?
Page 212:
The product team focuses on answering the question “Why?” above everything else. “The articulation of why we’re doing something, and always questioning our focus, rallies everyone around one compelling vision, company, and product, and creates a vital emotional connection with our customers,” Zach says. “Only once we understand ‘why’ can we really look at ‘what’ and ‘how’.”
Page 231:
For companies selling to an enterprise market, where click-to-invite virality isn’t the norm, there are other metrics that might work better. One is the net promoter score, which simply asks how likely a user is to tell his friendsabout your product and compares the number of strong advocates to those who are unwilling to recommend it. It’s a good prozy for virality.
Page 236:
What makes a good leading indicator?
- Leading indicators tend to relate to social engagement, content creation, or return frequency
- The leading indicator should be clearly tied to a part of the business model
- The indicator should come early in the user’s lifecycle or conversion funnel
- It should also be an early extrapolation so you get a prediction sooner
You find leading indicators by segmentation and cohort analysis. Looking at one group of users who stuck around and another group who didn’t, you might see something they all have in common.
Page 244:
To measure the health of the machine, divide how much you changed the annual recurring revenue in the past quarter by what it cost you to do so. You need three numbers to do this calculation:
- Your quarterly recurring revenue for quarter x (QRR[x])
- Your quarterly recurring revenue for the quarter before x (QRR[x-1])
- Your sales and marketing expense for the quarter before x (QExpSM[x-1])
(QRR[x] - QRR[x-1]) / QExpSM[x-1]
Page 268:
Page 283:
- The founders analyzed not only revenue, but also the cost of service delivery, and realized that high-revenue customers weren’t as profitable
- They intentionally priced one of their tiers unreasonably high to discourage customers from buying it while still being able to claim it publicly.
Page 285:
A good rule of thumb is that your acquisition cost should be les than a third of the total value a customer you over her lifetime.